Flattest Route in SF: Algorithms, Data, & Architecture
Key Takeaways
- •Pathfinding algorithms like Dijkstra and A* are significantly modified to prioritize minimal elevation gain.
- •High-resolution Digital Elevation Models (DEMs) are crucial for accurately calculating route slope and flatness.
- •Efficient geospatial data processing and graph database management are core to real-time route computation.
- •The application extends beyond casual navigation, benefiting accessibility, logistics, and urban planning.
Technical Specifications & Data
| Core Pathfinding Algorithm | Modified Dijkstra with weighted cost function for elevation gain |
| Elevation Data Source (Primary) | USGS National Elevation Dataset (NED) / LIDAR-derived DEMs |
| Elevation Data Resolution | 1-meter to 5-meter grid (depending on area coverage) |
| Road Network Data Source | OpenStreetMap (OSM) with custom attribute extensions |
| Graph Database Type | PostGIS with pgRouting Extension / Custom in-memory graph |
| Average Query Latency (5km route in SF) | 150-300 ms (cached routes faster) |
| Peak Server Memory Usage (Graph) | 4-8 GB for San Francisco Metropolitan Area |
| API Response Format | GeoJSON for route geometry, JSON for metadata (e.g., total elevation gain) |
| Frontend Mapping Library | Mapbox GL JS / Leaflet.js |
| Backend Programming Language/Framework | Python (Flask/Django) or Node.js (Express) |
| Flatness Cost Function Parameters | <code>Elevation Gain Weight: 5x-10x Distance Weight</code>; <code>Elevation Loss Weight: 0.5x Distance Weight</code> |
| Map Data Update Frequency | Monthly (OSM updates) / Quarterly (DEM updates) |
Technical Architecture Overview: Navigating SF's Topography
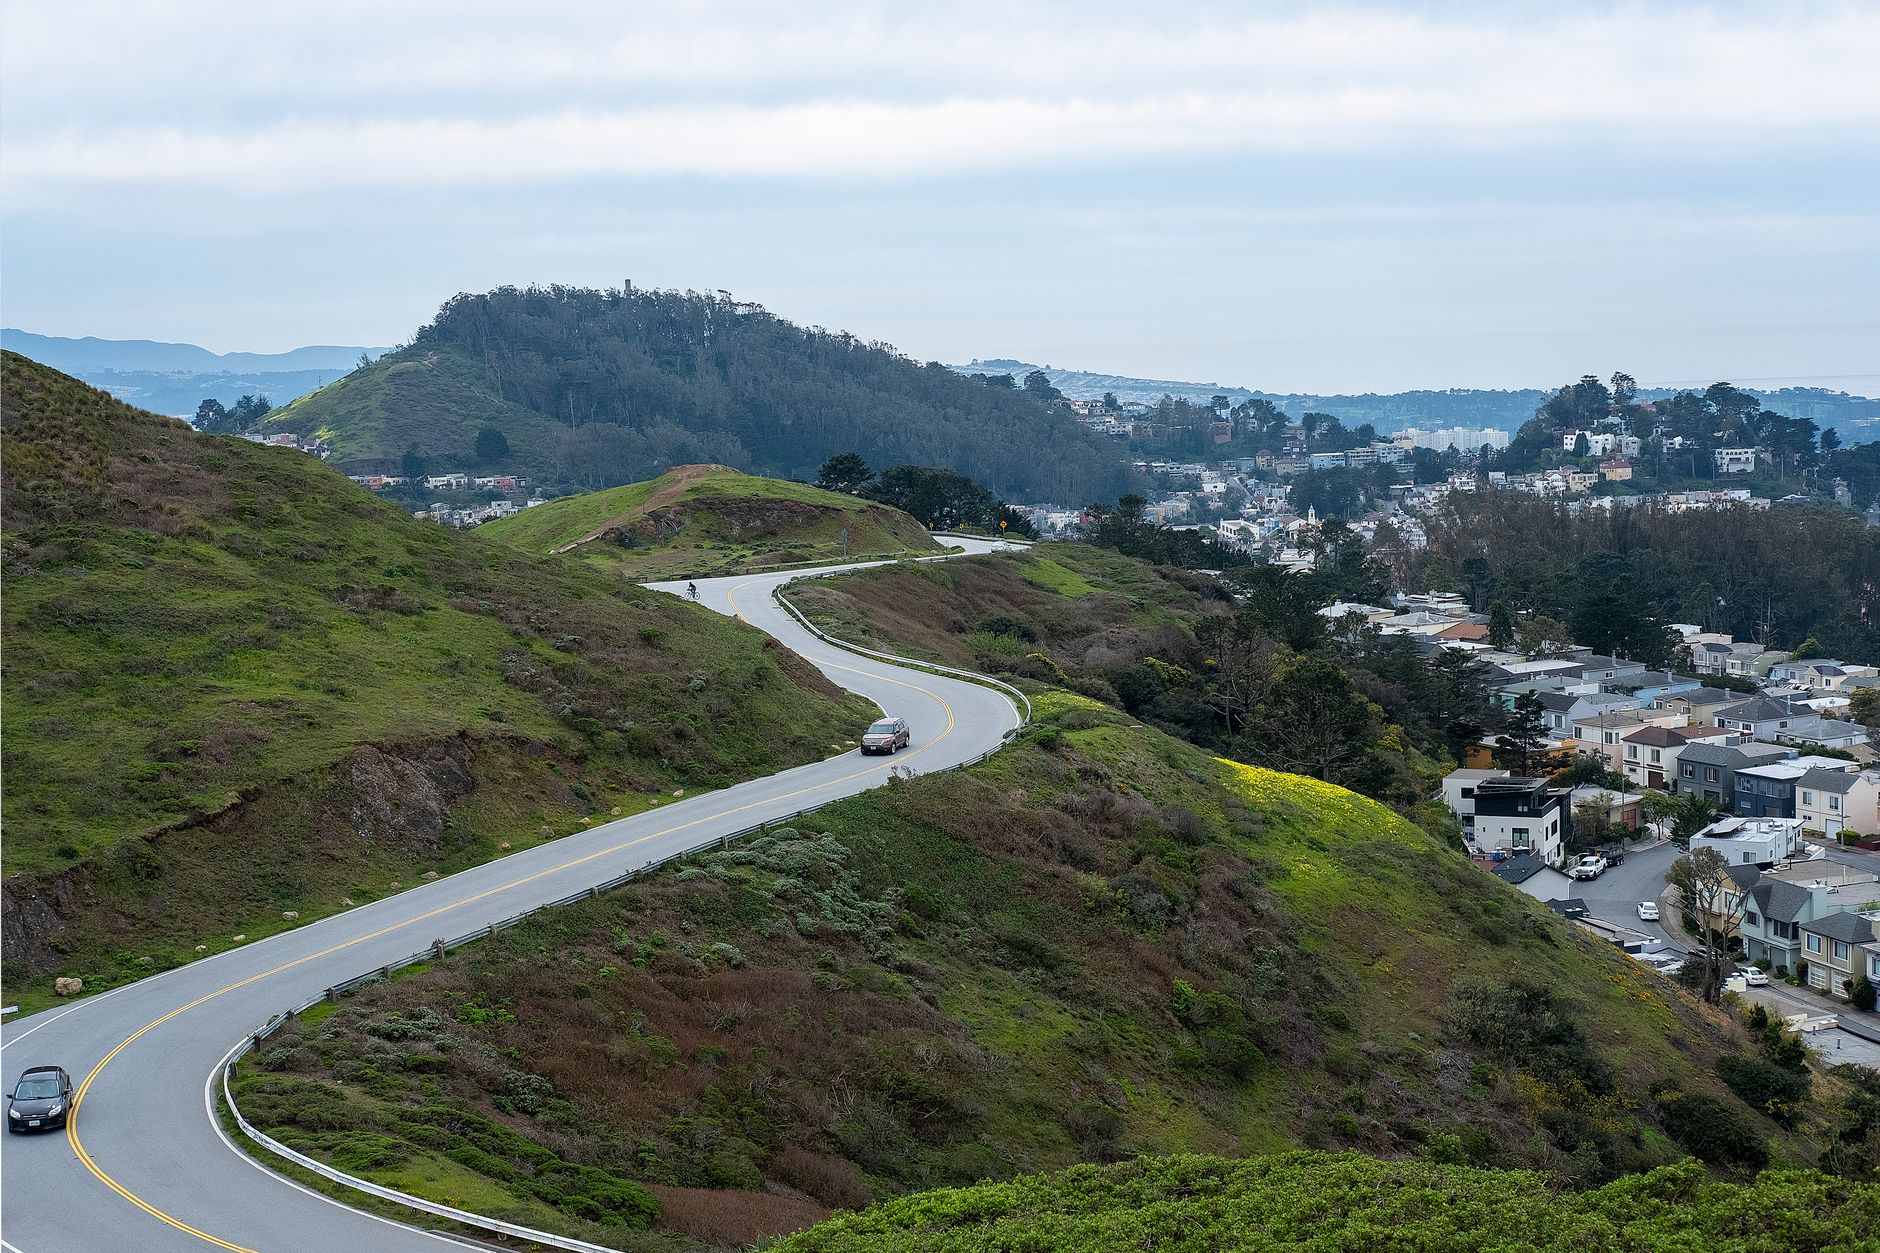
San Francisco's iconic hills present a unique challenge for navigation, making 'finding the flattest route' a compelling problem that demands sophisticated geospatial and algorithmic solutions. The technical architecture behind such a system typically involves several integrated components, from data acquisition to a user-friendly frontend interface.
At the foundation lies data acquisition and processing. The primary data sources include Digital Elevation Models (DEMs), which provide granular elevation data across the city, and comprehensive road network data, often sourced from OpenStreetMap (OSM). DEMs can range from publicly available SRTM (Shuttle Radar Topography Mission) data, with resolutions around 30 meters, to much higher-resolution LIDAR-derived data, offering sub-meter accuracy. The choice significantly impacts the precision of slope calculations. This raw data is then ingested into a processing pipeline where it undergoes cleaning, normalization, and conversion into a graph structure.
The graph construction is a critical step: road intersections become nodes, and road segments become edges. Each edge is enriched with attributes such as length, speed limits, and, crucially, elevation change. This elevation change can be represented as total rise/fall, or more precisely, as an average slope percentage along the segment. For large geographical areas like San Francisco, the graph might be tiled or partitioned to manage memory and computational complexity more effectively.
The backend services typically feature a robust geospatial database, such as PostGIS with its pgRouting extension, or a specialized graph database like Neo4j. These databases are optimized for storing and querying complex network data. A dedicated pathfinding service, exposed via a RESTful API, then handles route requests. This service orchestrates the algorithm execution, querying the graph database, and applying custom cost functions to prioritize flatness. Caching layers (e.g., Redis) are often integrated to store frequently requested routes or pre-computed segments, significantly reducing query latency for popular origins and destinations.
Finally, the frontend visualization layers provide the interactive map interface. Libraries like Mapbox GL JS, Leaflet, or OpenLayers are commonly used to render base maps, allow users to select start/end points, and display the computed flattest route prominently. User experience is enhanced with features like drag-and-drop markers, real-time feedback, and clear visual representation of route elevation profiles. Cloud infrastructure, such as AWS, Google Cloud Platform, or Azure, typically hosts these components, providing scalability, reliability, and global reach for the application.
Deep-Dive Systems & Performance Benchmarks: Optimizing for Flatness
The core intelligence of a 'flattest route' finder lies in its sophisticated pathfinding algorithms and the meticulous optimization of its underlying systems. Traditional pathfinding algorithms, such as Dijkstra's or A*, are designed to find the shortest path based on distance or time. For flatness, these algorithms require significant modification to incorporate elevation as a primary cost factor.
The modified cost function is paramount. Instead of merely minimizing distance, the algorithm must assign a higher penalty to elevation gain. A common approach is to weight segments based on a formula like: total_cost = (segment_distance * D_weight) + (elevation_gain * EG_weight) + (elevation_loss * EL_weight). Here, EG_weight would be substantially higher than D_weight, effectively penalizing uphill climbs more severely. Some implementations might even assign a negative (but smaller) weight to elevation loss to slightly prefer downhill segments without making them overly attractive. The A* algorithm's heuristic function can also be adapted to consider a 'flatter' straight-line distance, though this is more complex.
Data structures play a crucial role in performance. The road network graph is typically represented using adjacency lists or matrices, allowing efficient traversal. A priority queue (often implemented with a Fibonacci heap or binary heap) is essential for efficiently managing the exploration of nodes in Dijkstra's/A* algorithms.
To achieve real-time performance on a complex graph like San Francisco's, several optimization strategies are employed:
- Preprocessing: Before any query, the elevation profile for every road segment is pre-calculated and stored. This avoids expensive on-the-fly DEM lookups.
- Graph Simplification: Minor intersections or short road segments that don't significantly alter elevation profiles might be collapsed or simplified to reduce the total number of nodes and edges.
- Hierarchical Pathfinding: For very long routes, the system might first find a high-level path between major hubs and then detail the segments within those hubs, similar to how human navigation works.
- Spatial Indexing: Data structures like R-trees or Quadtrees are used to quickly identify the nearest graph node to a user's selected origin/destination points, accelerating the start of the pathfinding process.
- Parallel Processing: Graph construction and complex queries can be parallelized across multiple CPU cores or even distributed across servers to handle high load.
While specific benchmarks vary, a well-optimized system targeting San Francisco's data might demonstrate the following performance characteristics:
Average Query Latency (5km route): 150-300 msThese metrics are critical for ensuring a responsive and scalable service, especially when catering to a large user base or complex logistical operations. Continuous profiling and optimization are essential to maintain these performance levels as data resolution and user demand grow.
Graph Build Time (Initial Load): 2-5 hours (for entire city, high-res data)
Peak Server Memory Usage: 4-8 GB (for graph data & cache)
Routes Processed Per Second: 50-100 (single instance)
Why This Matters & Industry Impact: Beyond Simple Navigation
The ability to identify the flattest route between any two points, especially in a city with challenging topography like San Francisco, extends far beyond novel navigation for tourists. This technology has profound implications across multiple sectors, driving accessibility, efficiency, and smarter urban planning.
One of the most significant impacts is on accessibility and inclusive mobility. For individuals using wheelchairs, electric scooters, or those with other mobility impairments, steep inclines can be insurmountable barriers. A flattest route finder transforms urban navigation, offering pathways that are not just shorter but genuinely navigable for everyone. This empowers more independent living and participation in city life, aligning with principles of universal design. Similarly, for cyclists and pedestrians, avoiding punishing hills can make commuting or leisure activities far more enjoyable and sustainable, promoting healthier lifestyles.
In the realm of logistics and last-mile delivery, this technology offers substantial operational benefits. Delivery services, especially those utilizing electric vehicles (EVs) or human couriers, face increased battery drain and physical exertion on hilly terrains. By optimizing routes for flatness, businesses can:
- Improve EV range and battery life: Reducing uphill climbs extends the operational range of electric delivery fleets.
- Enhance driver/courier efficiency: Less strenuous routes lead to faster deliveries and reduced fatigue.
- Lower fuel consumption: For internal combustion engine vehicles, avoiding steep grades can lead to better fuel economy.
- Optimize drone and robot delivery paths: Autonomous ground vehicles need to negotiate terrain within their power and stability limits.
Furthermore, flattest route capabilities contribute significantly to urban planning and infrastructure development. City planners can leverage this data to understand pedestrian flow, identify areas where accessibility improvements are most needed, and strategically place amenities or public transport stops to maximize reach for all citizens. It informs decisions about sidewalk maintenance, ramp installations, and even the design of new public spaces.
Looking ahead, this technology serves as a foundation for even more sophisticated applications. Imagine integration with real-time traffic data to find the flattest route that also avoids congestion, or personalized profiles that adjust flatness preference based on a user's fitness level or vehicle type. The core principles can be applied to other hilly cities globally (e.g., Lisbon, Rome, Seattle), and even to specialized scenarios like hiking trail planning (minimizing or maximizing elevation gain for different experiences) or optimizing routes for autonomous vehicles to anticipate battery drain on grades. The evolution of such tools promises a more navigable, equitable, and efficient urban future.
Explore advanced geospatial tools and mapping APIs for your next project with leading cloud providers.
Chronological Timeline
Initial concept validation, data source research (DEM, OSM), and preliminary algorithm design.
Core algorithm development (modified Dijkstra/A*), graph database setup (PostGIS+pgRouting), and proof-of-concept backend API.
Private beta launch of 'Flattensf.com' for San Francisco, gathering user feedback on route accuracy and performance, with initial optimizations.
Public release with enhanced UI/UX, improved data resolution, and expanded caching mechanisms. Focus on accessibility features.
Integration of real-time traffic data, refined cost functions for different user profiles (e.g., cyclists, wheelchair users), and API expansion.
Frequently Asked Questions
How is 'flattest' route defined by the system?
What data sources are used to calculate elevation changes?
Can this technology be applied to other hilly cities besides San Francisco?
Daily Specs Editorial Staff
Lead Technical Analyst & Hardware Researcher
The Daily Specs editorial staff compiles, benchmarks, and verifies emerging technical specifications directly from system architecture manuals, hardware datasheets, and open-source codebases to deliver high-gain technical intelligence.